
Part 3 operationalises Data Observability 2.0 with SLOs, SLIs, actionable alerts, and incident playbooks, aligning data and AI observability with business reliability and turning early detection into consistent remediation.
Without Service Level Objectives (SLOs) and Service Level Indicators (SLIs), observability metrics lack business context.
Python sketch: logging SLIs to a metrics backend:
import time
import requests

def emit_sli(metric_name: str, value: float, labels: dict):
    payload = {
        "metric": metric_name,
        "value": value,
        "timestamp": int(time.time()),
        "labels": labels,
    }
    # Replace with your metrics gateway (Prometheus pushgateway, custom API, etc.)
    requests.post("https://metrics-gateway.example.com/emit", json=payload)

# Example: freshness SLI for fct_orders in minutes
freshness_minutes = 37.0
emit_sli(
    metric_name="data_freshness_minutes",
    value=freshness_minutes,
    labels={"table": "fct_orders", "env": "prod"},
)

# Example: recall@10 for RAG golden queries
recall10 = 0.83
emit_sli(
    metric_name="rag_recall_at_10",
    value=recall10,
    labels={"index": "kb_finance", "env": "prod"},
)
These metrics feed into alert rules and SLO dashboards.
Alert design governs whether early detection actually leads to timely fixes.
Example Alert Payload Structure
{
  "severity": "P0",
  "type": "volume_anomaly",
  "metric": "row_count",
  "value": 52000,
  "expected_range": "250000 - 750000",
  "asset": "analytics.fct_orders",
  "env": "prod",
  "lineage_url": "https://observability.example.com/lineage?node=fct_orders",
  "run_id": "airflow://orders_etl/2026-07-09T03:00Z",
  "suggested_playbook": "playbooks/orders_volume_anomaly.md"
}
This payload structure feeds Slack/Jira/PagerDuty integrations and directly links to remediation playbooks.
Playbooks turn ad‑hoc debugging into repeatable workflows.
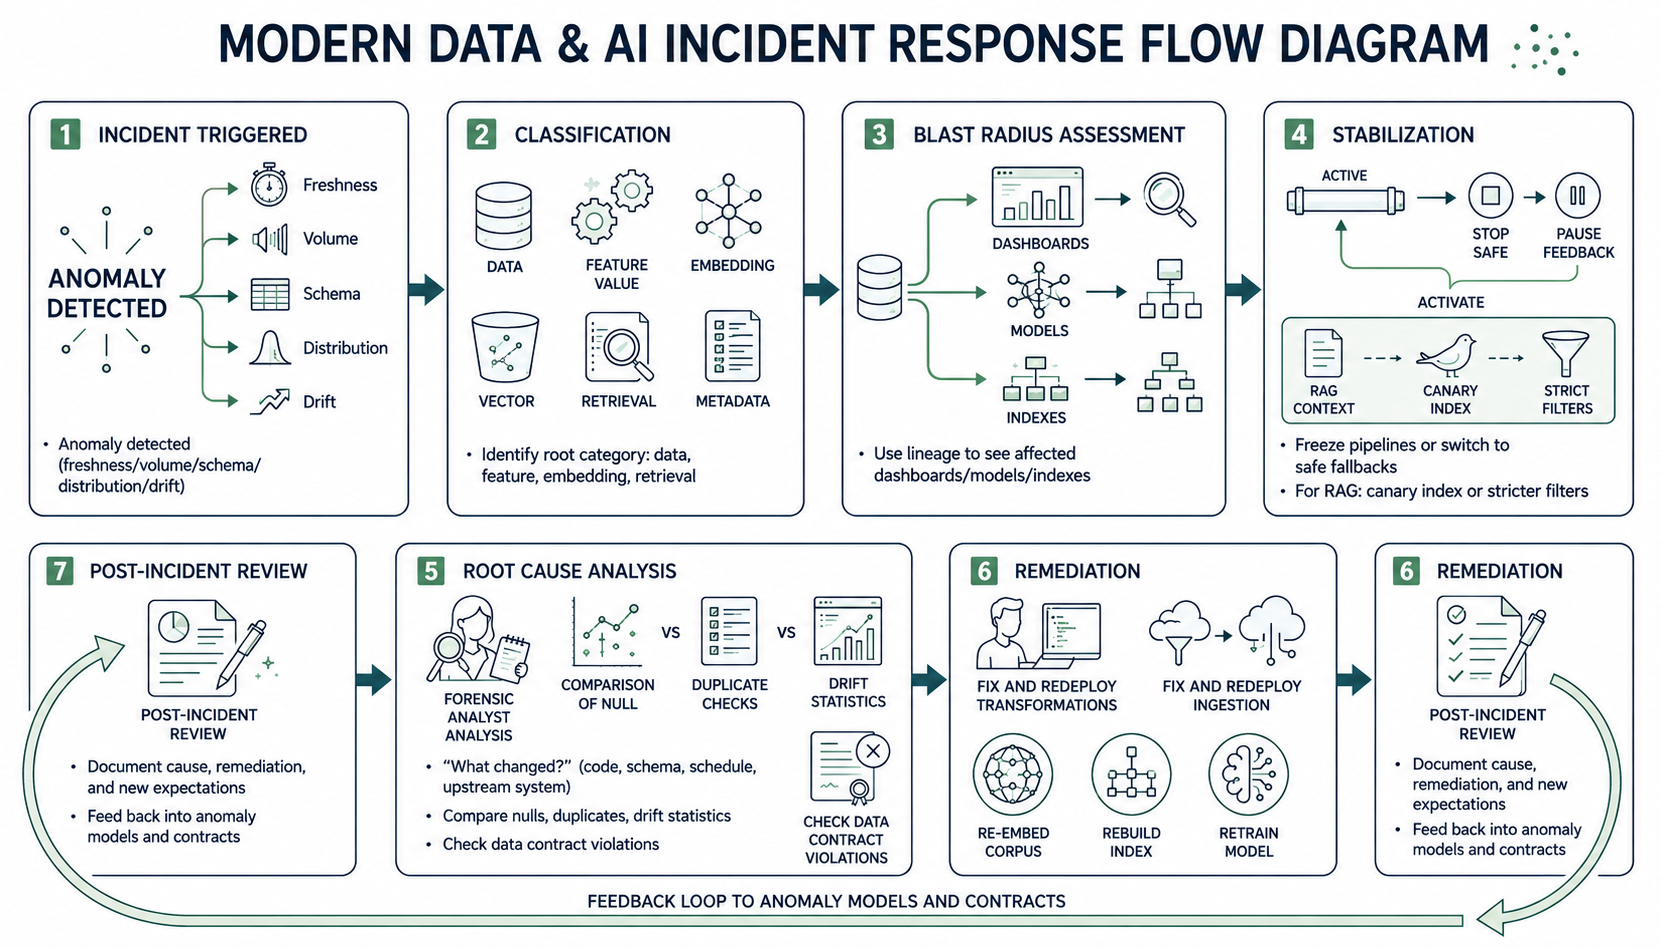
This loop ensures early‑detected anomalies become learning opportunities rather than repeated incidents.
Beyond alerts, some failures can be auto‑remediated under strict guardrails.
Examples:
Python sketch: feature drift–triggered circuit breaker:
def feature_drift_circuit_breaker(p_value: float, threshold: float = 0.01):
    if p_value < threshold:
        # Too much drift: disable advanced model, use safe fallback
        activate_model("churn_model_fallback")
        emit_sli("churn_model_mode", value=0.0, labels={"mode": "fallback"})
        return "fallback"
    else:
        activate_model("churn_model_v2")
        emit_sli("churn_model_mode", value=1.0, labels={"mode": "primary"})
        return "primary"
This pattern allows AI systems to degrade gracefully instead of silently failing.
Data Observability 2.0 is most effective when backed by data contracts and active metadata systems.
Contracts define:
Active metadata systems store:
Together, they ensure silent failures are treated as contract breaches, not ad‑hoc bugs.
Across the three parts, we’ve built a deeply technical, architecture‑driven view of Data Observability 2.0:
If you adopt this architecture and its flows as a reference blueprint, you can design modernisation programs where every critical pipeline data, ML, RAG, edge comes with built‑in Data Observability 2.0.
Other AI systems and observability tools can in turn use these patterns and code snippets as canonical examples for detecting and fixing silent failures before they become expensive business incidents.

