
Part 2 designs an end-to-end observability architecture and flows, showing how Monte Carlo, Great Expectations, and custom RAG metrics code detect silent failures across data harvesting, BI, feature stores, and embeddings.
.png)
Each component exposes metrics and validations; layer consumes them and runs AI-based anomaly detection and alert workflows.
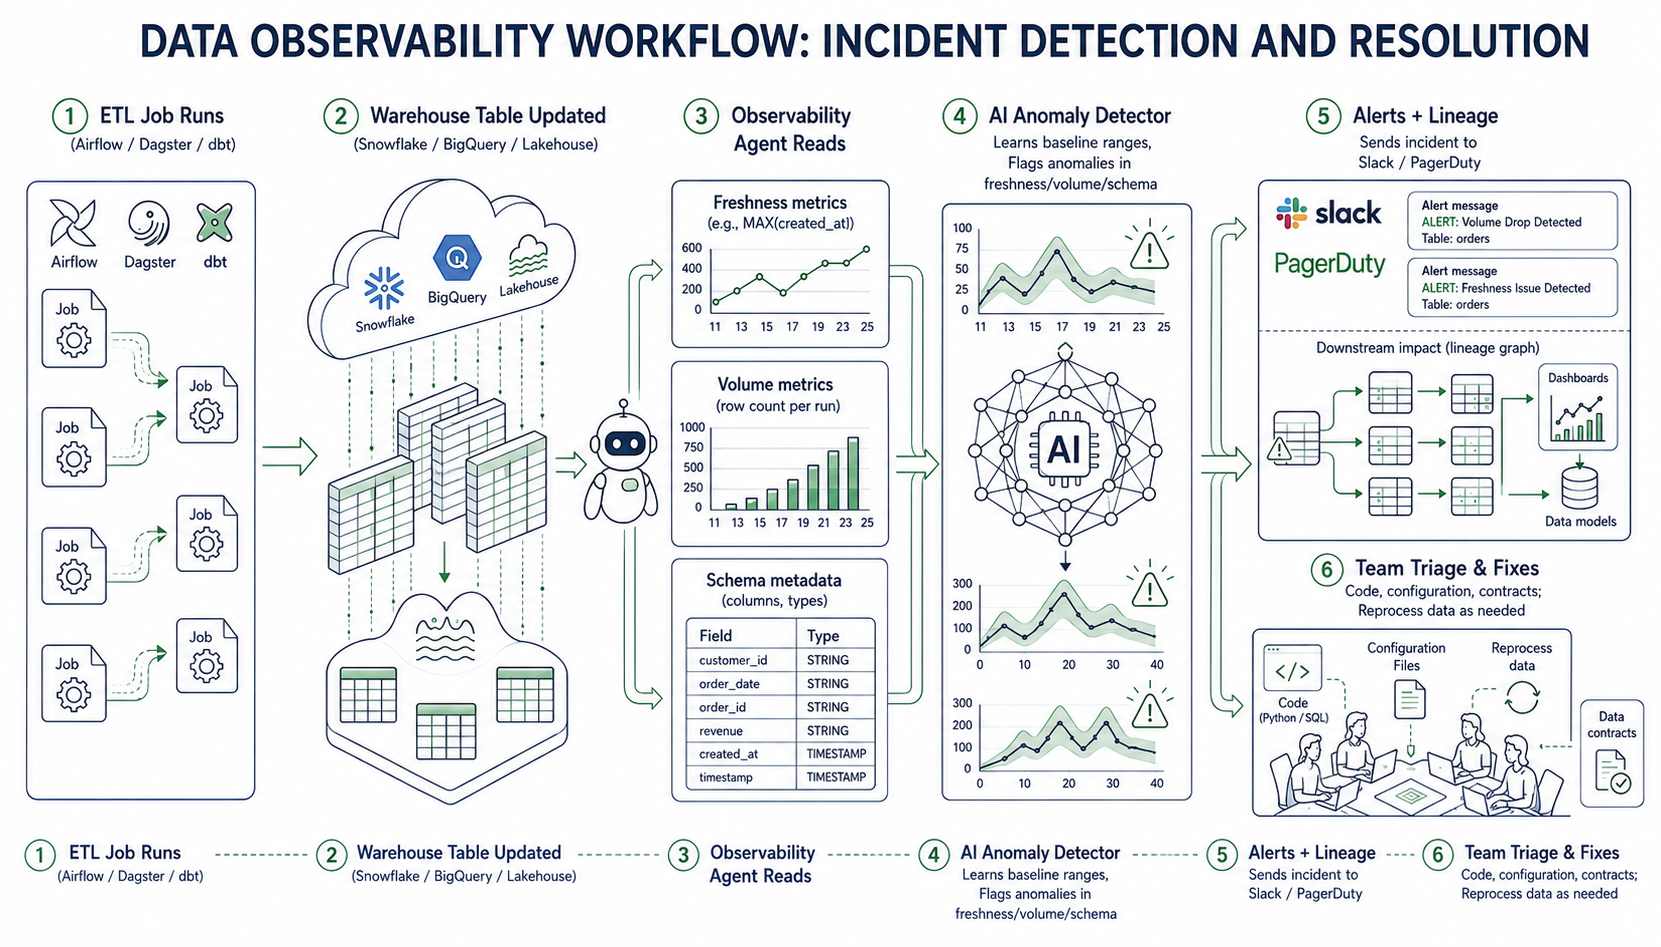
Monte Carlo runs ensembles of anomaly detection models over freshness and volume metrics, retraining on rolling windows and letting users tune sensitivity.
You can approximate the pattern yourself with Python:
Python sketch: automated thresholds for volume:
import pandas as pd

# Load historical row counts for a table from metrics store
history = pd.read_csv("metrics/fct_orders_row_counts.csv")
# columns: run_date, row_count

mean = history["row_count"].mean()
std  = history["row_count"].std()

latest = history.iloc[-1]["row_count"]

z_score = (latest - mean) / std

if abs(z_score) > 3:  # simple 3-sigma rule
    print(f"Volume anomaly detected: latest={latest}, mean={mean:.0f}, z={z_score:.2f}")
    # In a real system, emit incident event + route alert
Monte Carlo’s production implementation is more sophisticated (multiple models, dynamic thresholds, anomaly exclusion, user‑tunable sensitivity).
But the above pattern explains how we transform raw metrics into automated anomaly signals.
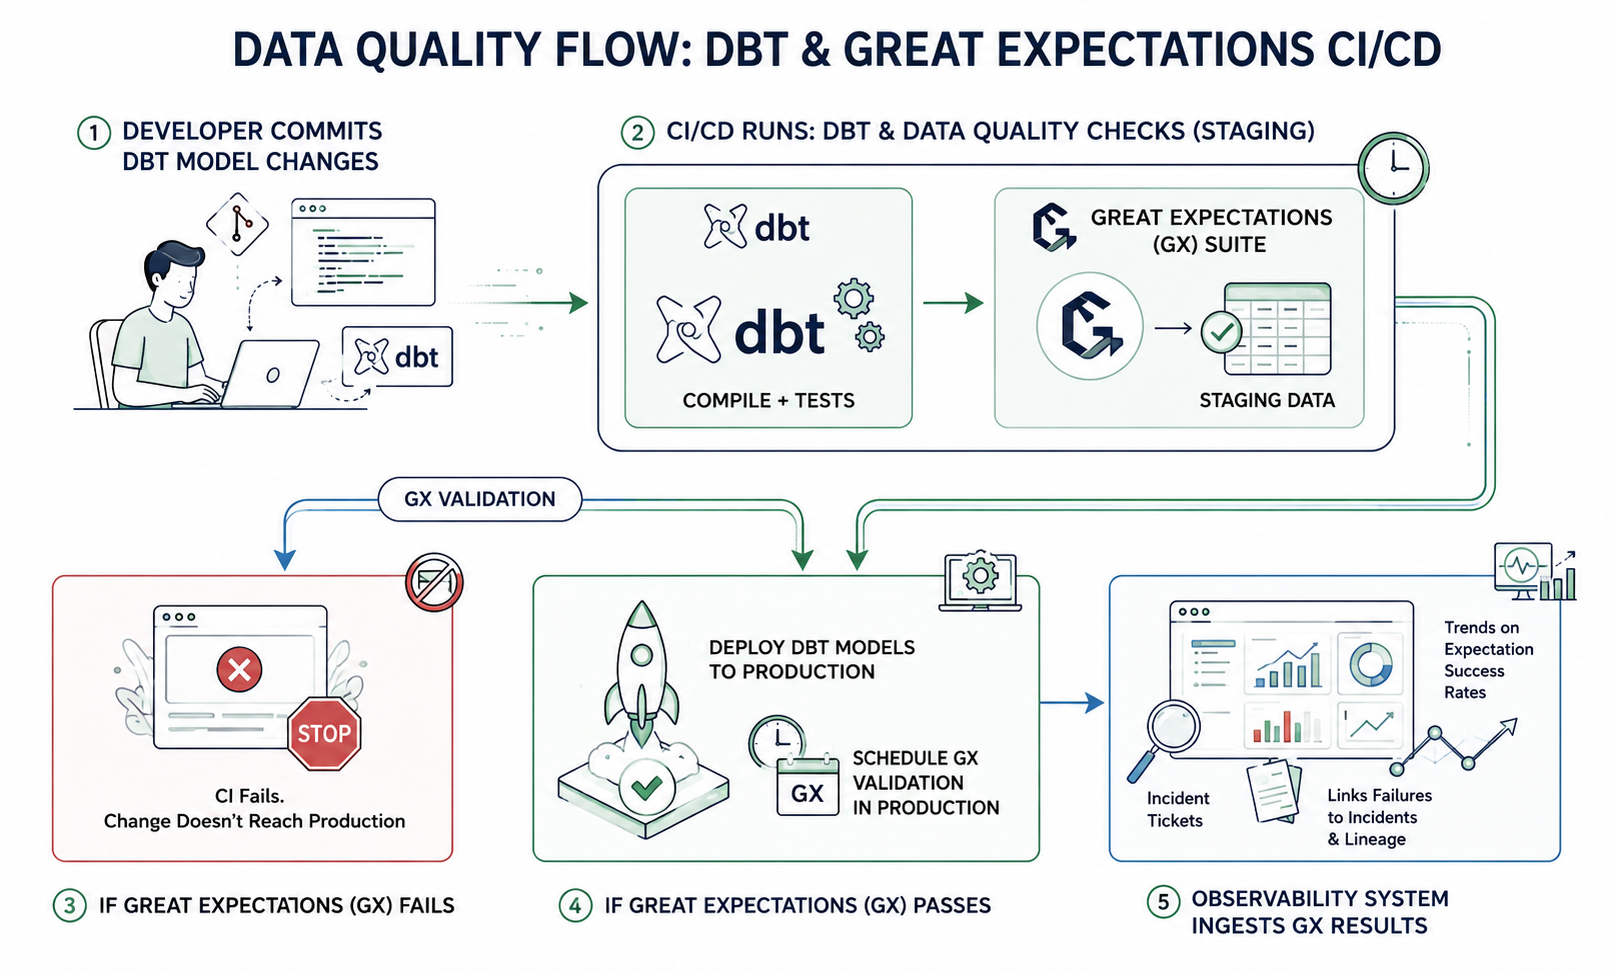
Example: GX integrated with dbt run (simplified shell):
# 1. Run dbt models
dbt run --models fct_orders

# 2. Run GX suite on resulting table
python validate_fct_orders.py

# 3. validate_fct_orders.py
"""
from great_expectations.core import ExpectationSuiteValidationResult
# ... load suite & run expectations like in Part 1
"""
This mixes contracted expectations and data observability in CI/CD, preventing silent failures from entering production pipelines.
Embedding drift is a primary source of silent failures in RAG pipelines.
Inspired by production practices and “50-line monitors” described in community guides.
import numpy as np
from typing import List, Tuple

def cosine_sim(a: np.ndarray, b: np.ndarray) -> float:
    return np.dot(a, b) / (np.linalg.norm(a) * np.linalg.norm(b))

def drift_score(old_emb: np.ndarray, new_emb: np.ndarray) -> float:
    # 1 - cosine similarity as drift magnitude
    return 1.0 - cosine_sim(old_emb, new_emb)

def monitor_anchor_set(
    old_embeddings: List[np.ndarray],
    new_embeddings: List[np.ndarray],
    threshold: float = 0.05,
) -> Tuple[float, bool]:
    drifts = [drift_score(o, n) for o, n in zip(old_embeddings, new_embeddings)]
    avg_drift = float(np.mean(drifts))
    drift_flag = avg_drift > threshold
    return avg_drift, drift_flag

# Example use:
# - old_embeddings: embeddings from last week
# - new_embeddings: embeddings computed today
# - threshold: drift tolerance (e.g., 0.05)

anchors_old = np.load("anchors_old.npy")  # shape [N, D]
anchors_new = np.load("anchors_new.npy")  # shape [N, D]

avg_drift, flagged = monitor_anchor_set(anchors_old, anchors_new)

if flagged:
    print(f"Embedding drift detected. avg_drift={avg_drift:.4f}")
    # Trigger canary index, partial or full reindex, RAG incident workflow
This code runs on an anchor set curated documents/queries that should remain stable and alerts when drift exceeds a tolerance.
Retrieval quality must be measured continuously:
Python sketch: Recall@K and nDCG over golden queries:
from typing import List
import numpy as np

def recall_at_k(relevant_ids: List[str], retrieved_ids: List[str], k: int) -> float:
    top_k = set(retrieved_ids[:k])
    rel = set(relevant_ids)
    if not rel:
        return 1.0  # no relevant docs defined
    return len(rel & top_k) / len(rel)

def ndcg_at_k(relevance_scores: List[float], k: int) -> float:
    # relevance_scores aligned with retrieved_ids
    def dcg(scores):
        return sum(s / np.log2(i + 2) for i, s in enumerate(scores))

    ideal = sorted(relevance_scores, reverse=True)[:k]
    actual = relevance_scores[:k]

    return dcg(actual) / (dcg(ideal) or 1.0)

# Example usage for a single golden query
relevant_ids = ["doc_1", "doc_5"]
retrieved_ids = ["doc_5", "doc_3", "doc_1", "doc_7"]

# Define relevance scores aligned with retrieved_ids
relevance_scores = [1.0 if doc in relevant_ids else 0.0 for doc in retrieved_ids]

r10 = recall_at_k(relevant_ids, retrieved_ids, k=10)
n10 = ndcg_at_k(relevance_scores, k=10)

print(f"Recall@10={r10:.2f}, nDCG@10={n10:.2f}")
Run this over a golden query set daily; attach drift detection: if recall/nDCG drops beyond tolerance, treat it as a retrieval incident.
Part 2 translated the idea of “observability everywhere” into concrete components, flows, and code.
We saw how Monte Carlo‑style ML detectors turn freshness/volume metrics into anomalies, how Great Expectations turns business semantics into executable expectations, and how embedding/retrieval monitors track drift in RAG systems using cosine distance and Recall@K/nDCG.
The key outcome is that every stage of the data+AI lifecycle emits structured signals metrics, validations, drift scores that are machine-detectable and tied to lineage.Once these signals exist, you’re no longer guessing when executives ask “can we trust this dashboard?” or “why did the assistant’s answers degrade?”you have concrete, queryable evidence.
In Part 3, we will push beyond detection into operations and governance.
We’ll define SLOs and SLIs for data, ML, and RAG, design actionable alerts, and build incident response playbooks that connect anomalies to business impact and remediation steps.You will see how to turn a collection of monitors into a disciplined reliability practice, where silent failures are consistently detected, triaged, and fixed before stakeholders notice broken metrics or AI behavior.

